Shape Generator

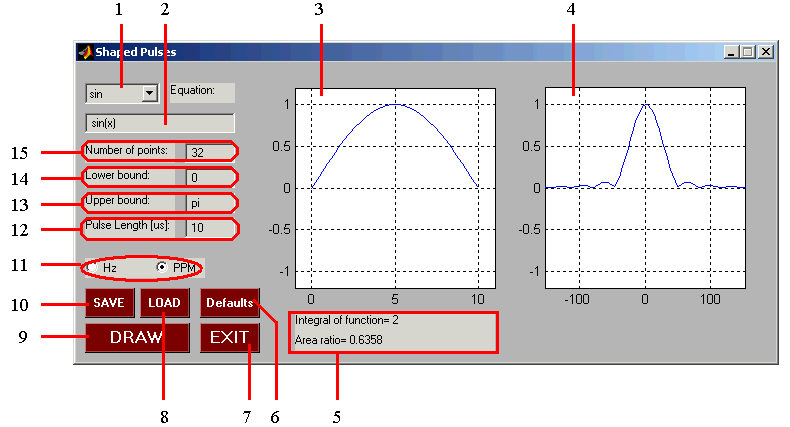
This window provides the means to generate, display, and store a shaped RF pulse or PFG.
- Shapes: This pull-down button provides a menu of standard shapes (select OTHER to define your oun shape).
- Other: Displays the analytical expression of the selected shape function and allows the user to enter/edit a user-defined shape.
Use this edit box so specify your own shape function (use Matlab conventions, i.e. a squared sine function should be written here as sin(x).^2 . In order to use this box, first select "OTHER" in the Shapes window (1). If a stored shape function is loaded, its analytical expression is shown in this box.
- Shape Display: A plot of the selected shape. The abscissa axis is the time axis.
- Excitation Profile: A plot of the Fourier transformation of the selected shape. The abscissa axis displays frequency in Hz or ppm.
- Data Analysis Box: Displays the integral (area under the graph) of the selected shape funstion and the ratio of this integral to that for a rectangular pulse of the same duration.
- Defaults: Click to set the default parameter values for a stadand shape function.
- EXIT button: Click to exit the Shape Generator and close the Window.
- LOAD button: Click to activate the load window in order to load shape function stored earlier.
- DRAW button: CLick to plot the selected shape function and its Furier Transformation.
- SAVE button: Click to activate the save window to save the selected shape for further use in the "experiment".
- Frequency units: Select frequency units (Hz or ppm) for the graph of the Fourier Transform. After the desired unit has been selected, click on the DRAW button to update the graphs.
- Pulse length [ms]: Specify the duration of the shaped pulse. The value of 0 will be interpreted as a value from the lower to the upper bounds, in ms.
- Upper bound: Specify the abscissa for the rightmost point (upper limit for x value) for the selected shape function.
- Lower bound: Specify the abscissa for the leftmost point (lower limit for x value) for the selected shape function.
- Number of points: Specify the number of data points to represent the selected shape.
BACK TO MAIN VNMR VINDOW
BACK TO VNMR MANUAL
Back to top
Page designed by David Fushman. Modified 11/26/2002.

